


You are here
Hoarding gold beats charts, technical analysis over 25 years
By Nicholas Larkin
Bloomberg News
Thursday, August 4, 2011
http://www.bloomberg.com/news/2011-08-04/hoarding-gold-beats-charts-over...
A buy-and-hold strategy for gold made investors more money during the past quarter century than any technical analysis tool.
While ichimoku chart, moving average oscillator, directional movement indicator, and variable moving average techniques as much as doubled profits since August 1986, holding onto bullion would have boosted investors' money more than fourfold, according to data compiled by Bloomberg. The returns from buying the metal and using 22 other individual strategies that use chart patterns don’t account for trading costs.
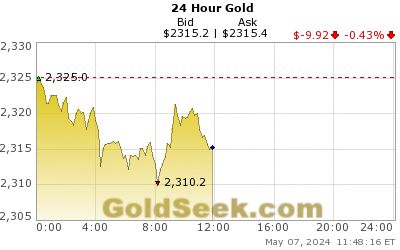
Gold rose to a record $1,681.65 an ounce yesterday and is set for an 11th straight annual gain, the longest winning streak since at least 1920. Central banks are expanding their gold reserves for the first time in a generation, joining billionaire investors including John Paulson in accumulating the metal. While a buy-and-hold technique does well in bull markets, technical traders can make money when prices rise and fall.
... Dispatch continues below ...
Lewis E. Lehrman on How to Solve the U.S. Debt Problem
Lewis E. Lehrman, chairman of the Lehrman Institute, sponsor of The Gold Standard Now project, advises that to reduce the $1 1/2 trillion U.S. deficit, the Republican Party must initiate an investment program.
Working Americans are not saving, which enables the banks to lead the country into a cycle of debt, leverage, boom, panic, and bust.
Lehrman says: Eliminating the budget deficit of a trillion and a half dollars cannot be done overnight. The proposal by U.S. Rep. Paul Ryan was very dramatic -- one Republican called it radical -- but it was not happily received. The solution, of course, is to design an American program for prosperity, because you can solve these entitlement problems with a growing economy. We need a tremendous program of investment, and investment comes from savings. When you pay savers, middle-income professionals, and working people 0 percent at the bank, you are not going to encourage them to save. Then we are left with a bank cycle of debt, leverage, boom, panic, and bust."
To read more and to sign up for The Gold Standard Now's free, noncommercial, weekly report, "Prosperity through Gold," please visit:
http://www.thegoldstandardnow.org/gata
"Increasingly investors are buying gold as a buy-and-hold rather than a buy-and-trade," said Jeffrey Nichols, New York-based senior economic adviser to Rosland Capital LLC. "Gold has been in a long-term bull market for many years and I think it will remain in a long-term bull market for at least several more years. There are technical tools that traders will use for trading and sometimes they work and sometimes they don't."
While holding bullion would have made money in all of the past 11 quarters, more and more people may be turning to charts to help them trade. The Society of Technical Analysts said its membership jumped 60 percent since June 2002. In technical analysis, investors and analysts study charts of trading patterns and prices to predict changes in an asset or security.
Using ichimoku charts, developed by Goichi Hosoda in the late 1930s before he released the findings in the 1960s, returned the most for copper and platinum in the past 25 years, the data show. Wheat gave the biggest profits using a moving average oscillator, while crude oil and silver fared best when using a buy-and-hold strategy.
Gold surged more than sixfold since the end of 2000, beating the 9.3 percent gain in the MSCI All-Country World Index of equities and a 78 percent return on Treasuries, according to a Bank of America Merrill Lynch index. Debt woes in Europe and the U.S. and concern over slower growth helped push the metal to all-time highs in euros and pounds this week. Bullion traded at $1,679.80 an ounce by 3:18 p.m. in London yesterday.
Paulson & Co. is the largest shareholder in the SPDR Gold Trust, the biggest exchange-traded product backed by gold, with a stake now valued at $5 billion. Warren Buffett, with a net worth of $50 billion, says the metal has no utility.
"They take it out of the ground in South Africa, ship it to the Federal Reserve, where they put it back in the ground," Buffett said in answer to a question about commodities on April 30 at Berkshire Hathaway’s annual meeting in Omaha, Nebraska. "If you were watching from Mars, you might think it's a little peculiar."
The buy-and-hold strategy hasn't always been the best for gold. The ichimoku method, which uses a cloud and lines based on median prices to provide what some investors refer to as a "chart at a glance," returned the most profit since August 2007, the data show. The Williams %R momentum indicator was the best tool in the five years through 1992.
Investors holding gold make money when prices are rising. Still, using technical analysis allows traders to profit from dips in a bull market or when an asset fluctuates, said Axel Rudolph, a technical strategist at Commerzbank AG in London. Those studying charts tend to use a combination of indicators and levels to form both short- and long-term forecasts, increasing the chance of making a more informed trade, he said.
"The advantage of technical charts compared to buy-and-hold is that you can get out in periods when the market underperforms, and even for gold there is seasonality, so with technical analysis you can fine tune it all," Rudolph said. "The more different technical tools you use which all give you the same picture, then the higher the probability is that you’re going to be right."
While nearly all techniques have default settings designed for a range of assets, users can make adjustments to suit different markets and trends and potentially make more money. A relative strength index typically uses key high and low levels of 70 and 30 derived from averaging gains or losses over 14 days, though traders can widen or narrow the gap depending on the strength of the market, for example.
Gold will reach $1,938 in 2012, according to the median in a survey last month of the four most-accurate precious-metals forecasters tracked by Bloomberg over the past two years.
"There are more retail investors coming into the market" for a protection of wealth, said Nichols, who is also managing director of American Precious Metals Advisors. "Retail investors tend to hold onto these investments for a longer period of time."
* * *
Join GATA here:
Toronto Resource Investment Conference
Thursday-Friday, September 15-16, 2011
Sheraton Toronto Centre
http://cambridgehouse.com/conference-details/toronto-resource-investment...
The Silver Summit
Thursday-Friday, October 20-21, 2011
Davenport Hotel, Spokane, Washington
http://cambridgehouse.com/conference-details/the-silver-summit-2011/48
New Orleans Investment Conference
Wednesday-Saturday, October 26-29, 2011
Hilton New Orelans Riverside Hotel
http://www.neworleansconference.com/
Support GATA by purchasing gold and silver commemorative coins:
https://www.amsterdamgold.eu/gata/index.asp?BiD=12
Or by purchasing a colorful GATA T-shirt:
Or a colorful poster of GATA's full-page ad in The Wall Street Journal on January 31, 2009:
http://gata.org/node/wallstreetjournal
Or a video disc of GATA's 2005 Gold Rush 21 conference in the Yukon:
Help keep GATA going
GATA is a civil rights and educational organization based in the United States and tax-exempt under the U.S. Internal Revenue Code. Its e-mail dispatches are free, and you can subscribe at:
To contribute to GATA, please visit:
Sona Drills 85.4g Gold/Ton Over 4 Metres at Elizabeth Gold Deposit,
Extending the Mineralization of the Southwest Vein on the Property
Company Press Release, October 27, 2010
VANCOUVER, British Columbia -- Sona Resources Corp. reports on five drillling holes in the third round of assay results from the recently completed drill program at its 100 percent-owned Elizabeth Gold Deposit Property in the Lillooet Mining District of southern British Columbia. Highlights from the diamond drilling include:
-- Hole E10-66 intersected 17.4g gold/ton over 1.54 metres.
-- Hole E10-67 intersected 96.4g gold/ton over 2.5 metres, including one assay interval of 383g of gold/ton over 0.5 metres.
-- Hole E10-69 intersected 85.4g gold/ton over 4.03 metres, including one assay interval of 230g gold/ton over 1 metre.
Four drill holes, E10-66 to E10-69, targeted the southwestern end of the Southwest Vein, and three of the holes have expanded the mineralized zone in that direction. The Southwest Vein gold mineralization has now been intersected over a strike length of 325 metres, with the deepest hole drilled less than 200 metres from surface.
"The assay results from the Southwest Zone quartz vein continue to be extremely positive," says John P. Thompson, Sona's president and CEO. "We are expanding the Southwest Vein, and this high-grade gold mineralization remains wide open down dip and along strike to the southwest."
For the company's full press release, please visit:
http://sonaresources.com/_resources/news/SONA_NR19_2010.pdf